Today’s newsletter will be a bit different than past issues. Rather than covering a climate solution or a wonky policy, I want to share some news with you all.
For much of this year, I’ve been building a new product and company called Cleanview. And today I’m finally sharing it publicly.
In this issue, I want to share why I built Cleanview, how you might be able to use it, and what I plan to build in the future. I realize some of you may just want the tl;dr version, so I’ll start with that.
The tl;dr update
Cleanview is a software platform that you can use to track clean energy trends and projects. The platform crunches millions of data points each month and tracks more than 30,000 existing and planned clean energy projects and power plants across the U.S.
The beta version of the product is already being used by innovative clean energy companies, non-profits, investors, and researchers. If you want to join them, you can sign up here.
Today, the product is focused on clean electricity in the United States. But the plan is to expand to other sectors (e.g. home electrification, EVs, etc) and geographies soon. (If you have suggestions or requests, I’m all ears).
I’m also going to be writing a newsletter for Cleanview. You can expect to read data-driven clean energy stories like last month’s The Rise of the Clean Energy Megaproject story. If you like Distilled’s stories that feature a lot of charts, I think you’ll enjoy this new publication. You can sign up for that newsletter here:
I will still be writing the Distilled newsletter. So stay tuned for more stories on climate solutions, barriers to action, and, yes, many more nerdy data visualizations.
Why Cleanview?
Ok, so why build a software product to track clean energy and decarbonization trends?
As loyal Distilled readers know, this publication is data-driven. Whenever I make a claim or aim to describe a trend, I do my best to back it up with recent data or research. Often this takes the form of a simple chart—sometimes a very big chart. But behind nearly every chart I make is hours of searching for, cleaning, analyzing, and visualizing data. For some stories, I spend about as much time doing research and data analysis as I do writing.
I’ve wasted many hours lost in spreadsheets due to the fact that energy data is often poorly organized and formatted, sometimes missing entirely.
As I’ve spoken with other folks, I’ve learned that I’m not the only person who has experienced these challenges. Policymakers, clean energy companies, non-profits, investors, and many other people have told me they too have lost hours to mind-numbing spreadsheets or missed important insights because energy data is difficult to access.
My hope is that Cleanview will be a valuable tool that helps these folks—and maybe you too.
How you can use Cleanview
Today, you can use Cleanview to track trends in utility-scale solar, wind, and battery storage across the United States.
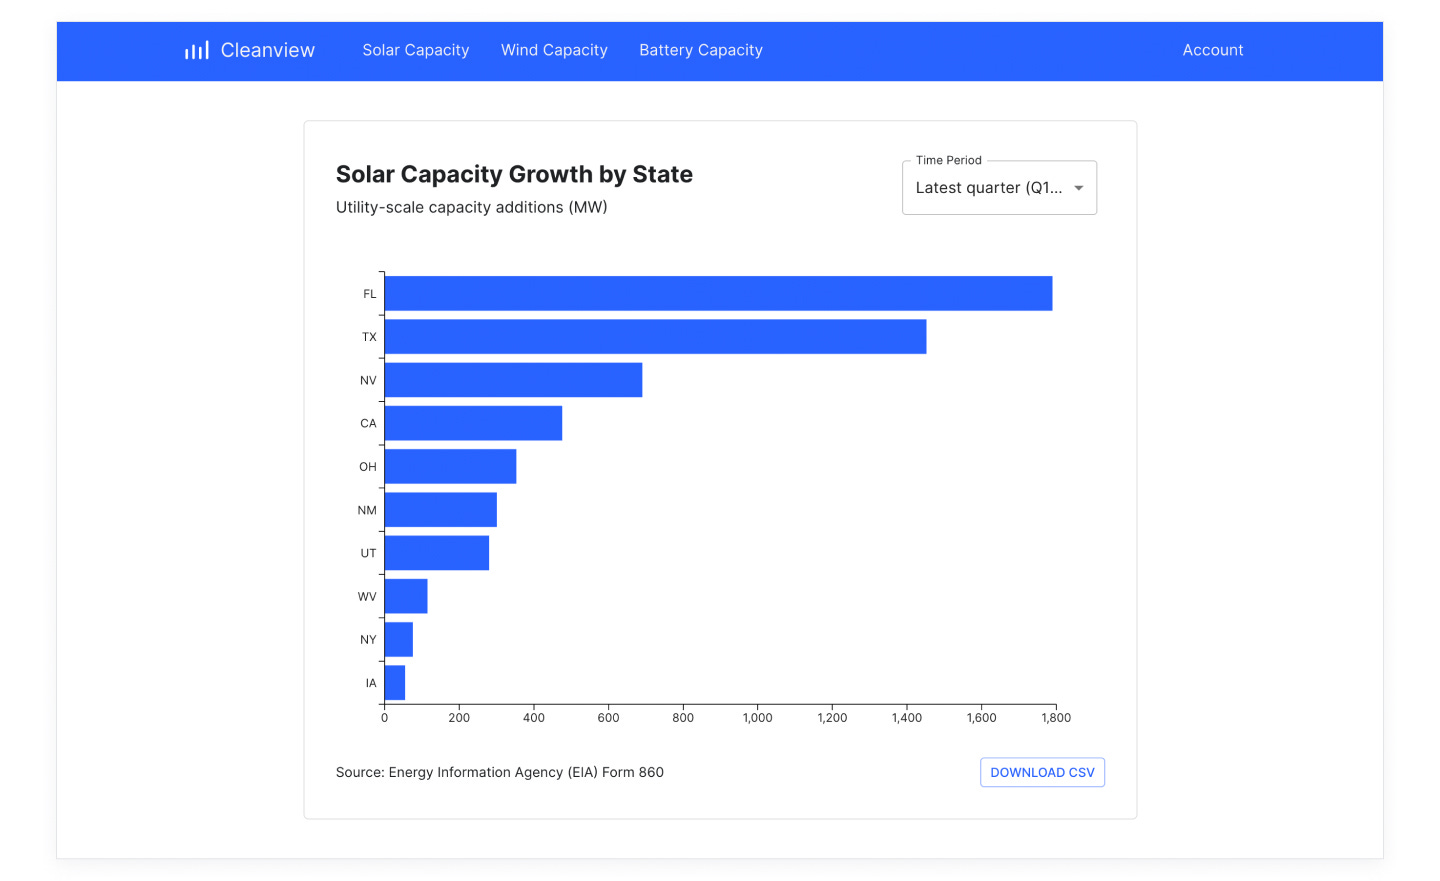
For example, you can analyze which states added the most solar capacity over the last quarter:
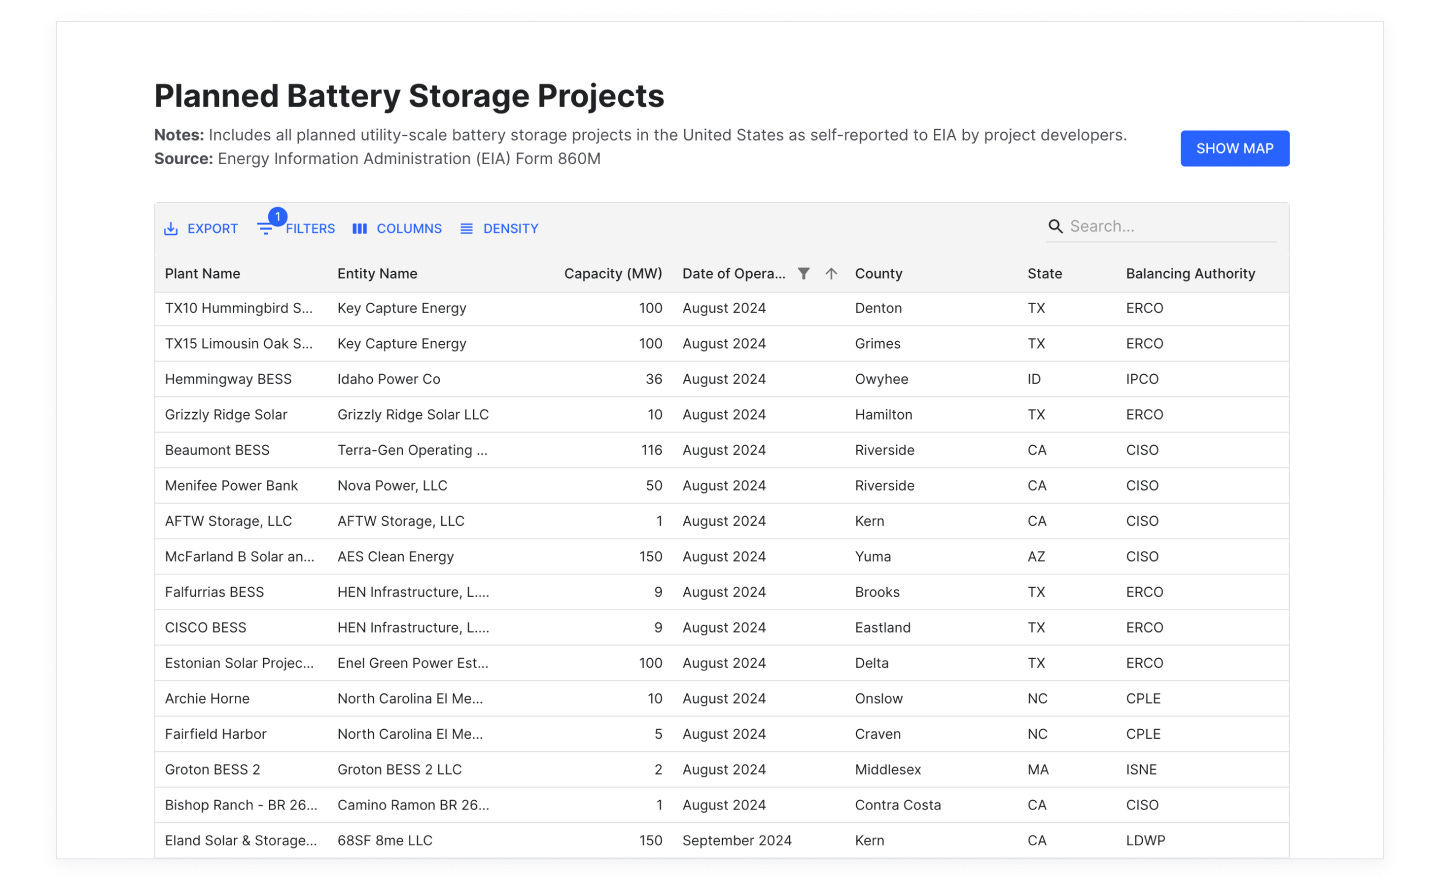
Or you can see how much battery storage capacity is expected to come online in each state over the next 24 months.
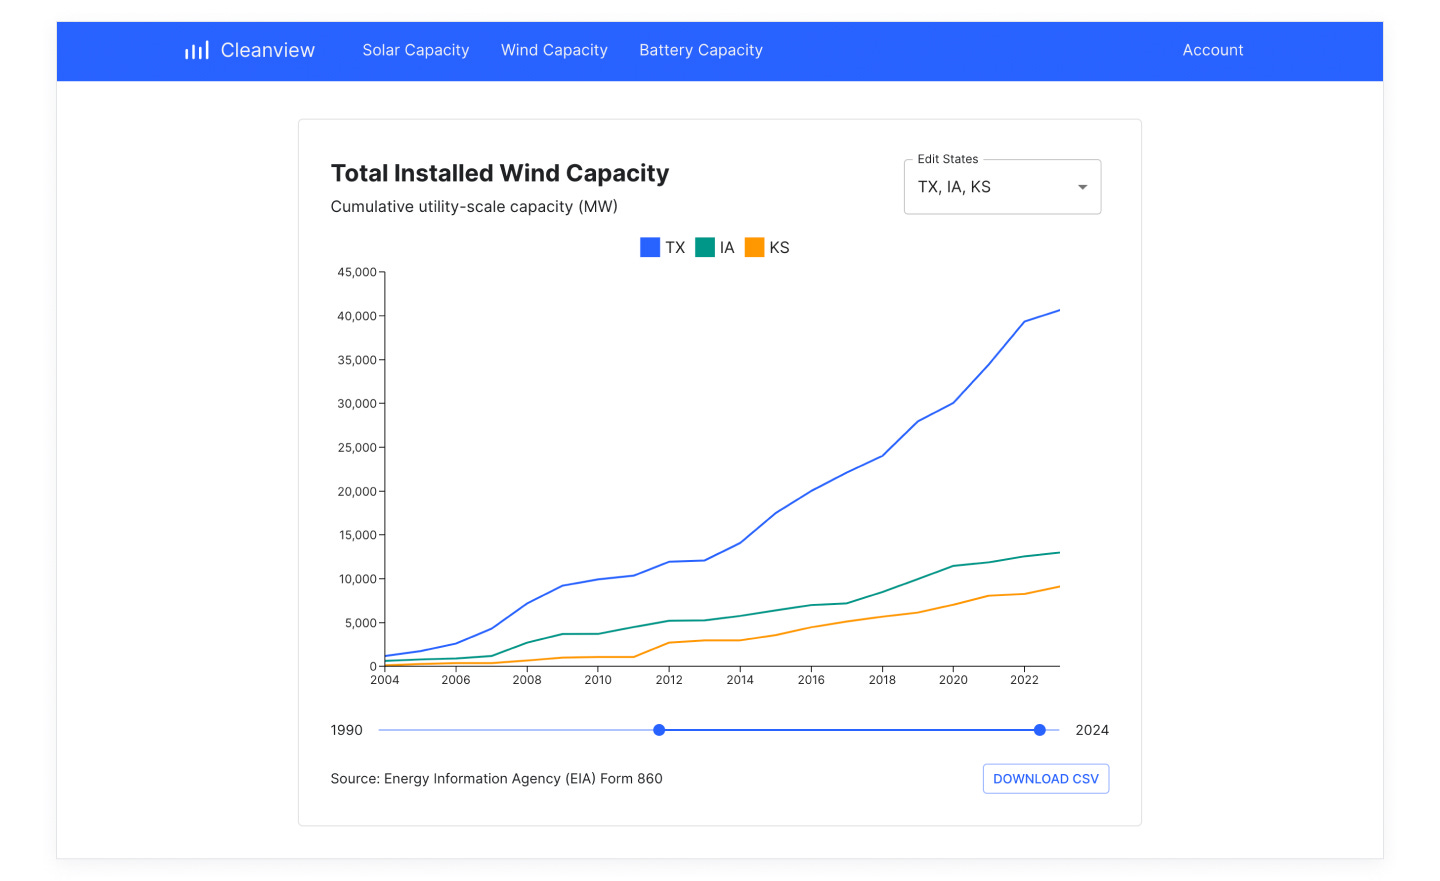
Or you can compare how much wind power capacity has been built in each state for the last 20 years.
View clean energy projects and power plants
In addition to seeing macro-trends, you can zoom in on specific clean energy projects or fossil fuel power plants and see features like their owner, capacity, balancing authority, and location.
Cleanview has data on both operating power projects and planned projects. The current dataset includes more than 30,000 power plants and clean energy projects across the United States.
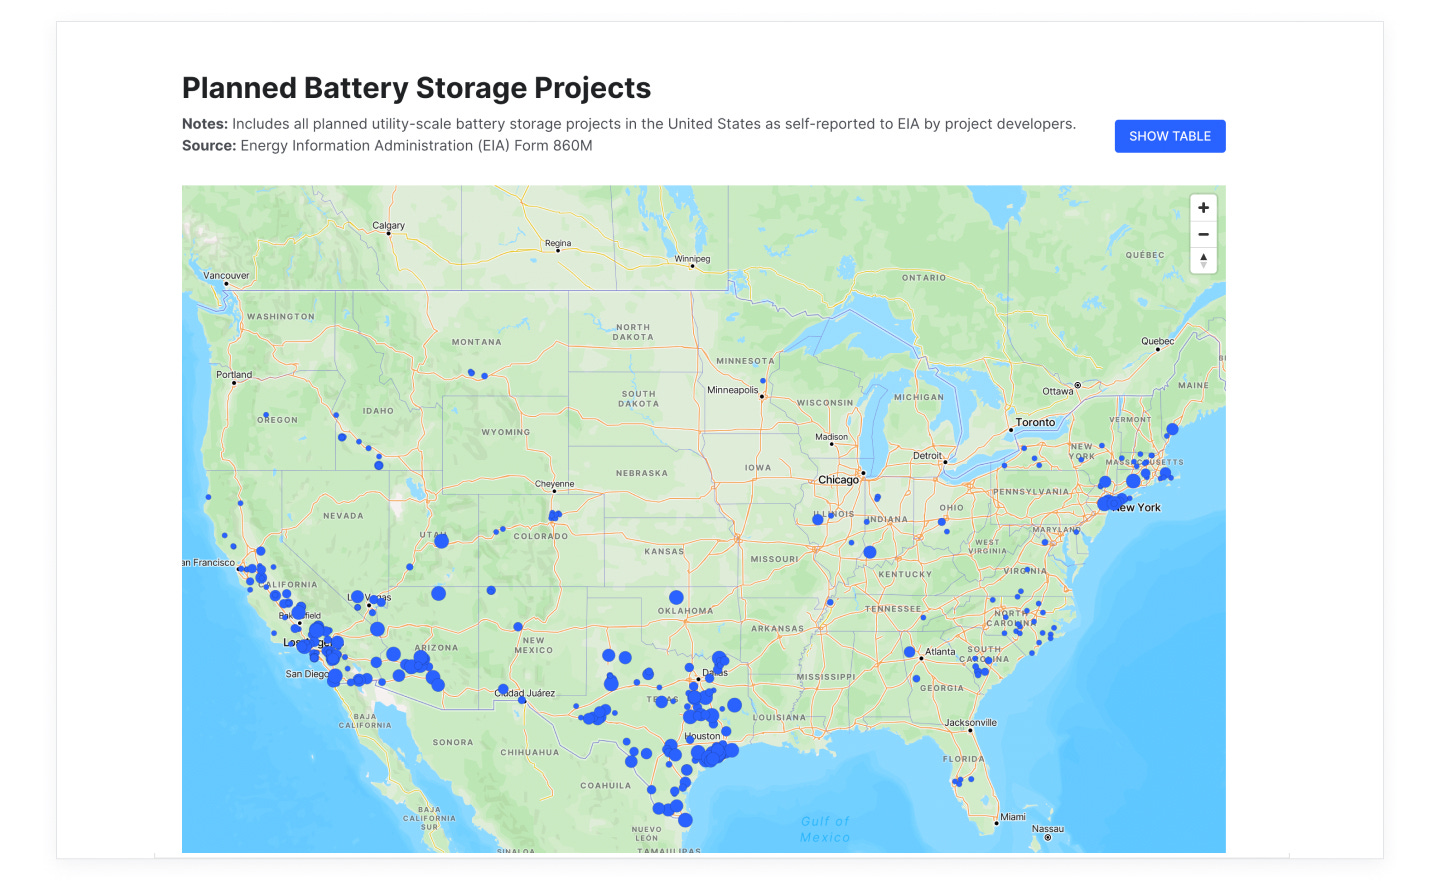
View projects and power plants on a map
You can also view both existing and planned clean energy projects and power plants on a map.
To give a few more examples of the types of insights you can find in the product, here are three stories that I wrote for the Cleanview newsletter:
Florida added more solar capacity than any other state last quarter
Solar and batteries will make up 80% of new power capacity this year in the U.S.
Plans for the future
Over the next few months, I’m planning to add many more clean energy datasets and analysis tools. Here are a few features to expect soon:
Hourly and daily generation and emissions data by balancing authority (e.g. ERCOT, CAISO, etc).
Monthly generation data by state
FERC Electric Quarterly Report (EQR) data that will show how much revenue clean energy projects make
Fossil fuel plant retirement trends and data
Later this year, I’m planning to add data from other geographies (e.g. Canada, Europe, etc.) and sectors (e.g. home electrification trends, EV sales, etc).
Finally, I’m planning to use Cleanview to write more ambitious—and, I hope, insightful—stories for this newsletter.
I want to end this by saying thank you to everyone who has supported Distilled over the last two years. Writing this newsletter has been and continues to be a source of joy and purpose in my life. I look forward to writing many more stories. To everyone reading this, thank you.
Sign up for Cleanview
If you’re interested in using Cleanview, you can sign up by clicking the button below. There is both a free version and a paid version of the product.
If you’d prefer instead to just follow along and read the Cleanview newsletter, you can sign up for that here:


Congratulations on this (and all your other great work), this will be very useful, considering how much data there is out there and how difficult it's been to stuff it into meaningful boxes. It will be an important resources for journalism in particular, for sure.
I hope someday you can expand to include nuclear. True, the projects are so few that keeping track of them isn't as much a mess as for the others, but comparisons will be meaningful..
Looks awesome!