

This post was originally published on the Cleanview newsletter, which I also write.
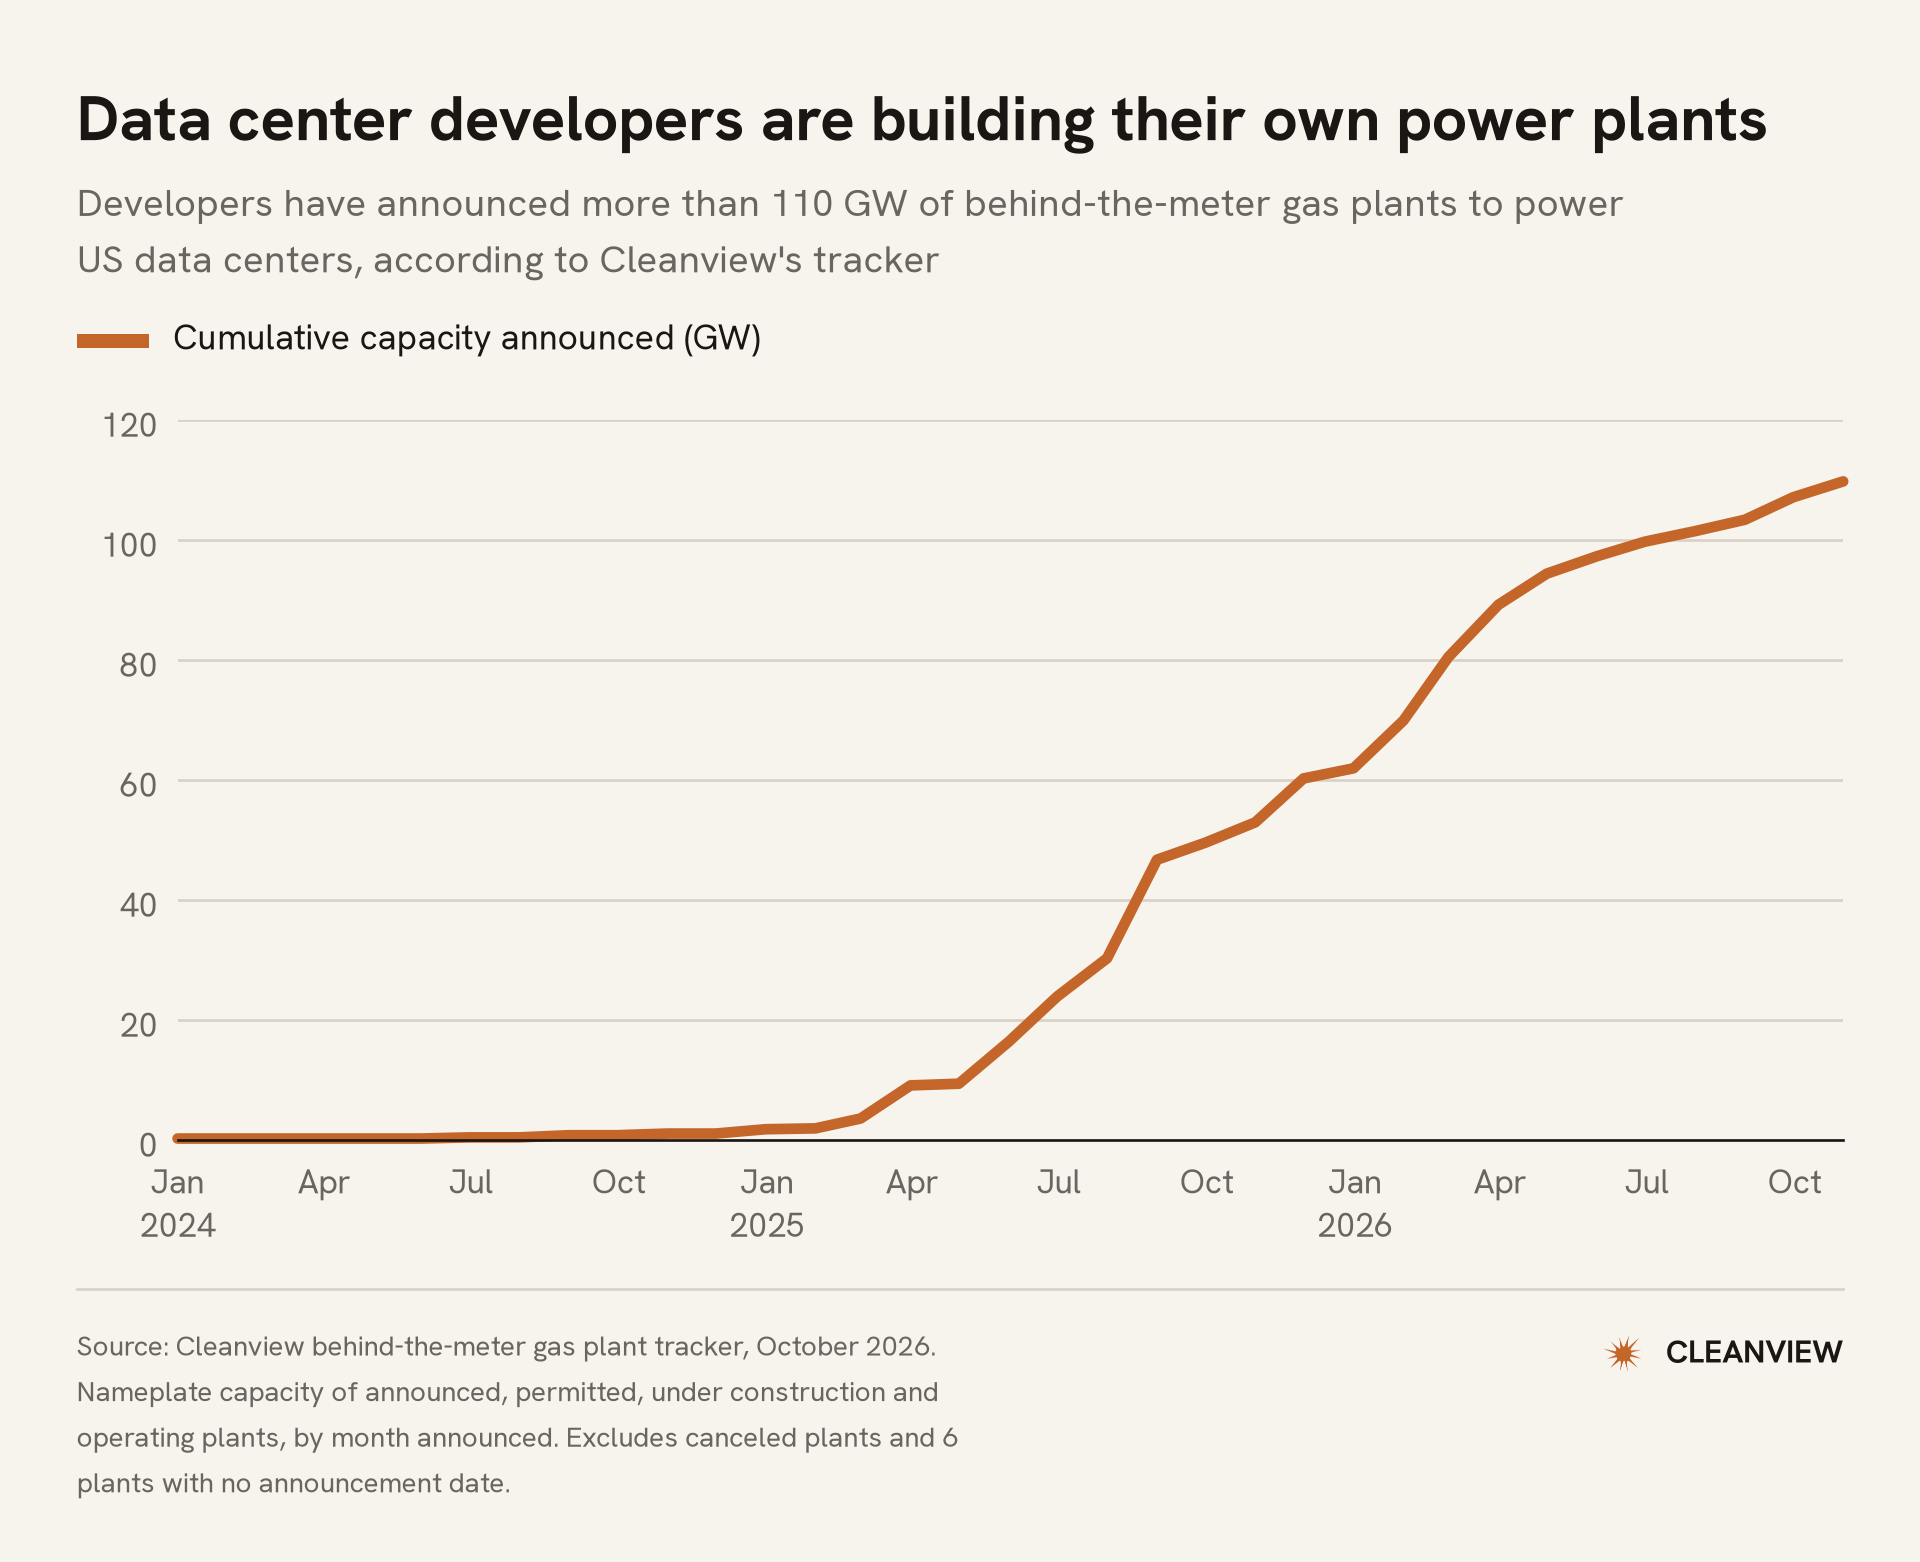
Data center developers are building their own gas power plants rather than wait years for a grid connection. In June, we published our second report on this trend. At the time, developers had announced about 90 GW of behind-the-meter generation, roughly nine New York Cities’ worth of power.
Our original plan was to publish a quarterly report on this topic. But we soon realized this was too infrequent given the speed at which this trend was evolving.
To illustrate what we mean, consider a few data points:
The amount of operating behind-the-meter capacity has nearly doubled since we published our last report.
Capacity under construction has roughly quadrupled.
Anthropic has gone from an insignificant buyer of behind-the-meter gas power to one of the largest.
So we decided to scrap our original plan and build something much better. Today we’re excited to announce Cleanview’s live behind-the-meter gas plant tracker. It covers more than 100 gas plants built to power data centers, and we update it every day.
What’s included
For each behind-the-meter gas plant, we now show:
The data center campus it powers, and the plant’s developer
Every generating unit: its technology (simple-cycle turbine, reciprocating engine, combined cycle or fuel cell), manufacturer, model, unit count and nameplate capacity
The status of each unit (Announced, Permitted, Under construction, Operating or Canceled) and the year it’s expected to come online
Firm output, the power a plant can actually deliver to its data center, where a developer or permit discloses it
The plant’s location, air permit and primary sources
All of this data is available in our data platform, CSV exports, and API.
Satellite images
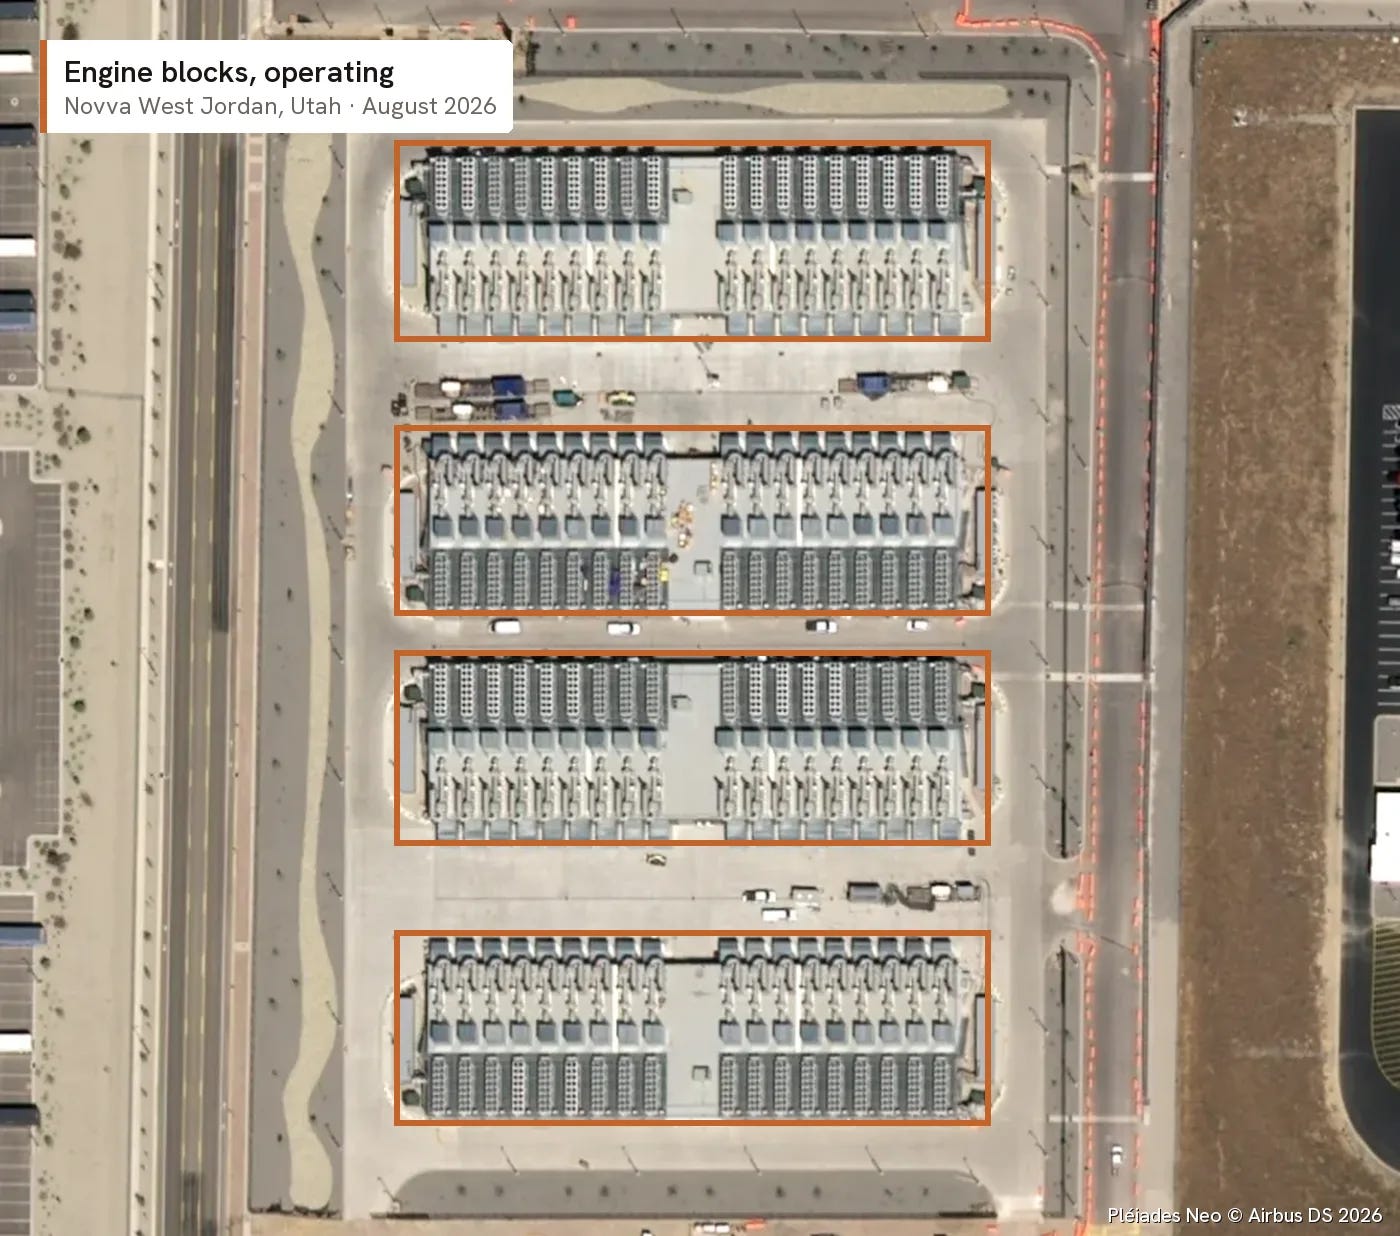
On our data platform, we also provide satellite images of all the projects we track. Below is an example of a project that recently began operating despite receiving almost no media attention. It’s one of the largest behind-the-meter projects operating in the country.
Equipment library
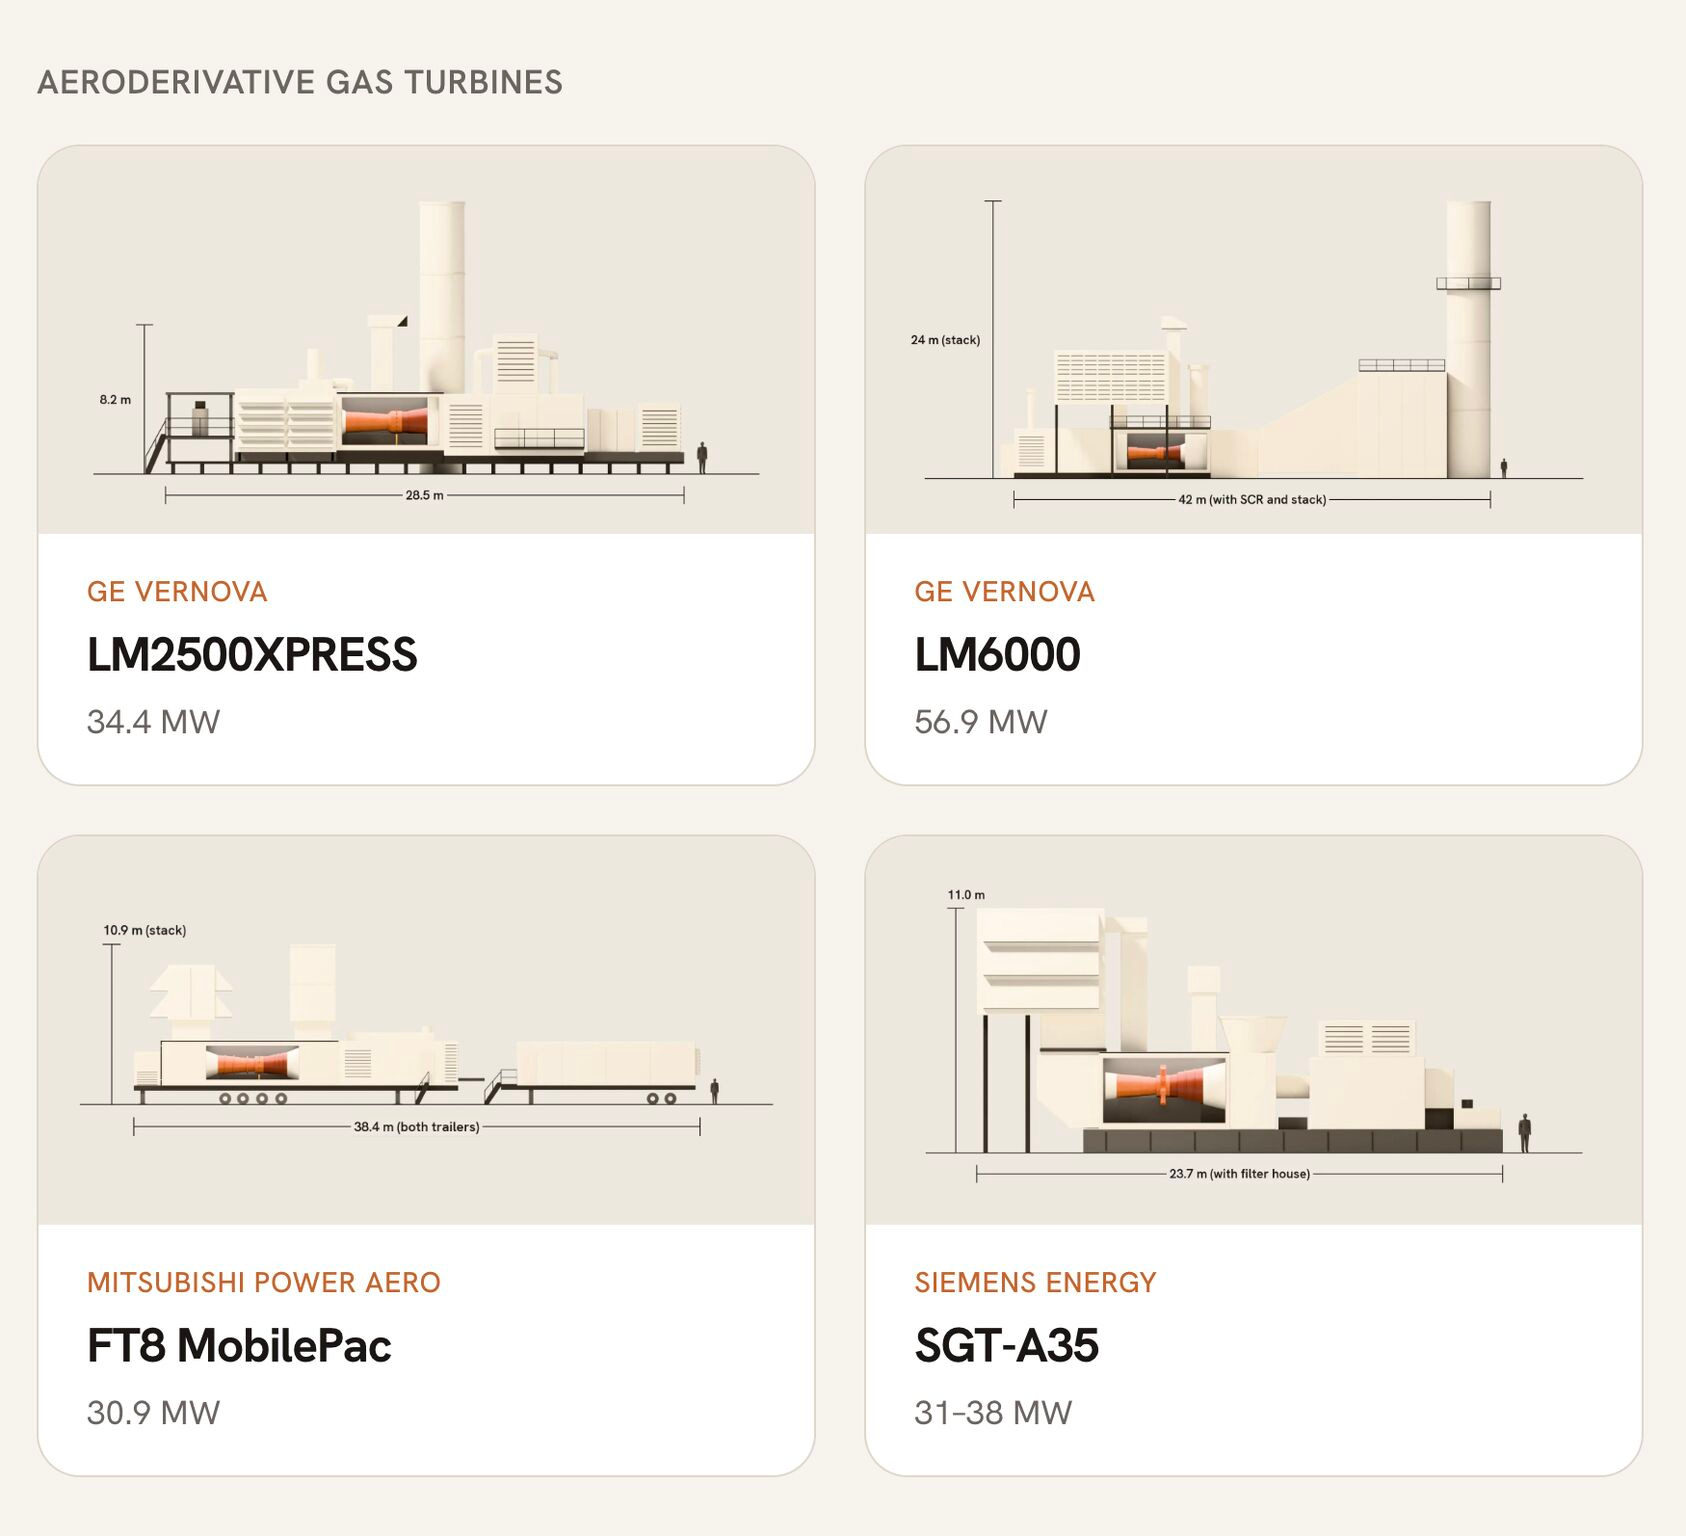
In our research on this topic, we’ve come across some power strategies that have surprised us. Some developers are using mobile gas generators strapped to semitrucks. Others are using aeroderivative turbines originally designed for aircraft and warships.
To better understand these power strategies we built an equipment library with illustrated 3D models of every piece of power generation equipment at the behind-the-meter data centers we track.
We could have just captured this in a spreadsheet. But sometimes seeing is believing. We also think it’s the little things that make for a great product experience. (At least that’s how we’re justifying the countless hours spent on these illustrations to Rory in finance).
Documents and sources
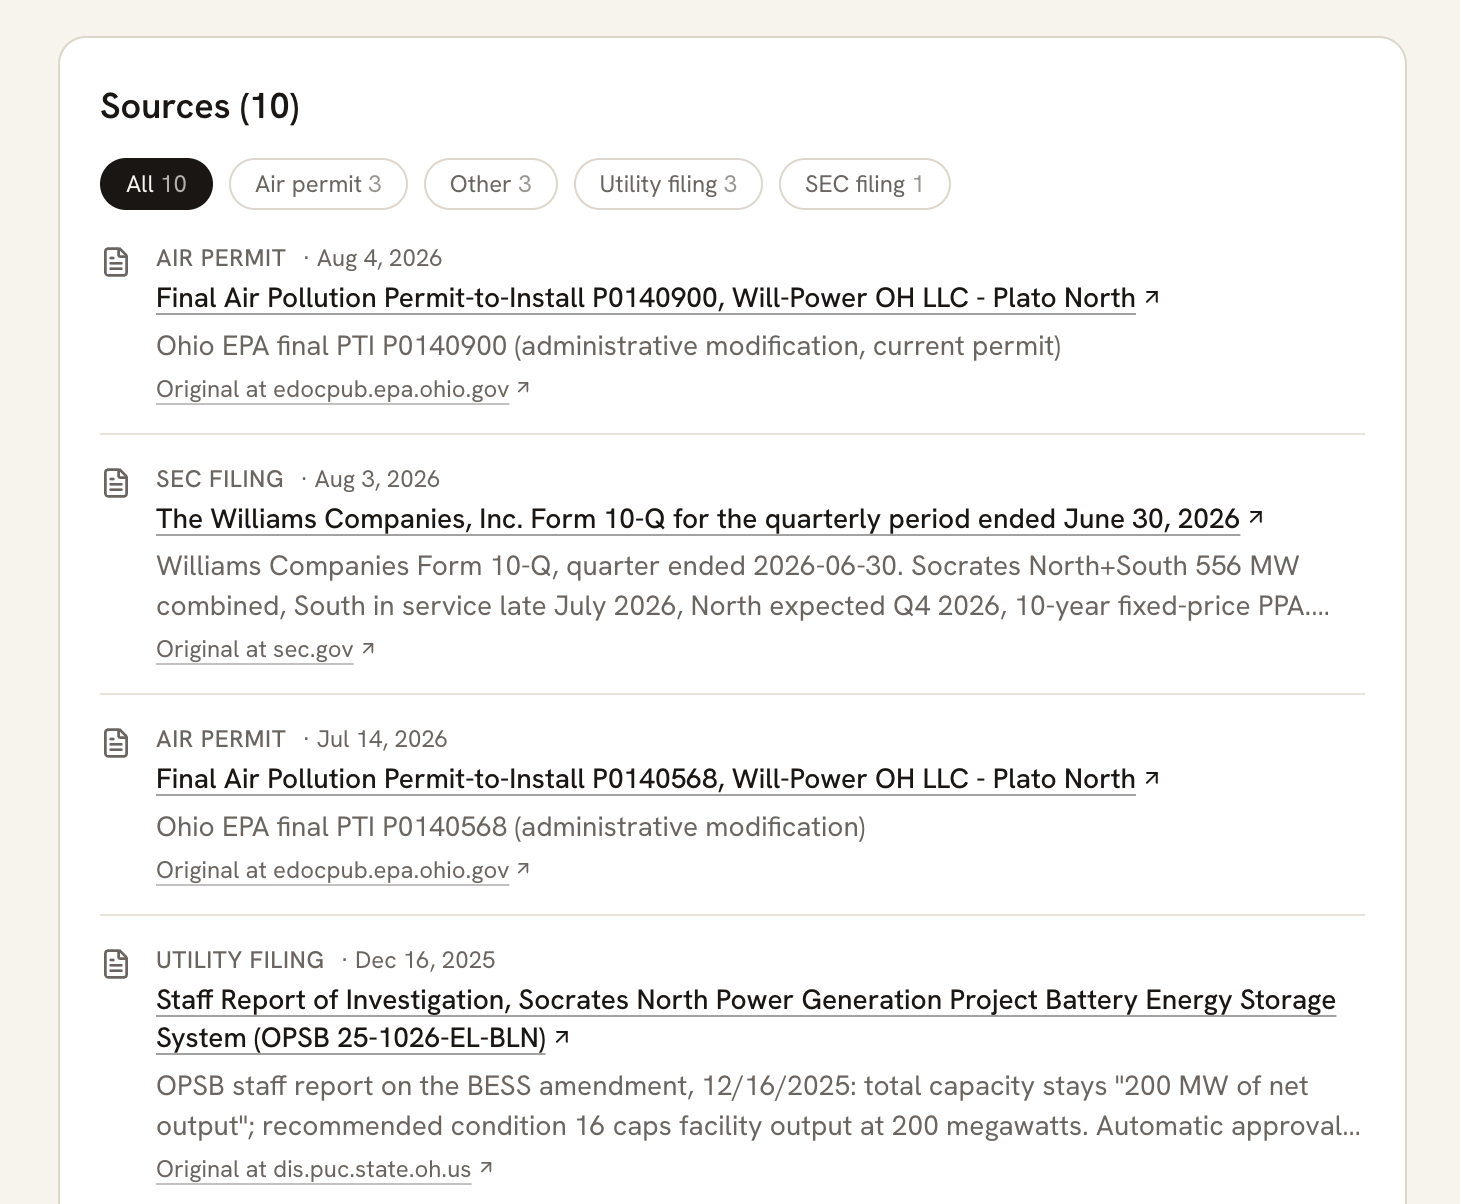
In our research, we often collect dozens of documents for a given project—everything from air permits to SEC filings to county site plans. These documents are difficult to find but include a treasure trove of information.
In our behind-the-meter data subscription, we include all relevant source files we come across in our research.
Chat with us to learn more
Over the coming weeks, we plan to share insights from this growing dataset. In the meantime, if you’d like to see a demo of the new BTM tracker or connect with our team, send us a note.

The thing I'd spell out for a newcomer: 100 GW is the width of the hose, not the water that comes out. A plant rated at 100 MW and running half the time delivers half the energy of one running flat out. Which is why the per-unit status labels — announced, permitted, under construction, operating — are the useful part; they let you separate the pipeline from what's actually humming.
The "build your own plant" shift lines up with what the grid side shows: PJM's generation queue sits at 374.6 GW across 1,261 projects, and its Data Center Power Index bands read CAUTION on constraint and AVOID on excess power, while ERCOT reads BUILD on both. Behind-the-meter gas is in effect a hedge against that queue wait. Curious whether the tracker shows the BTM pipeline clustering in constrained ISOs like PJM, or in ERCOT, where the grid route still looks open. DC Hub (dchub.cloud), as of Oct 21, 2026.