

This post was originally published on the Cleanview newsletter, which I also write.
This week we launched a completely overhauled version of the Cleanview platform and many of our free tools, along with a new brand and logo.
As a company, we feel a responsibility to make our products as easy to use as possible. Companies and investors use our data to make billion dollar investment decisions. The US Senate is currently using the platform to inform policy decisions. And our free tools have been used by almost a million people over the last year.
Thanks for reading Cleanview Newsletter! Subscribe for free to receive new posts and support my work.
Typically brand and product design announcements come with a lot of fluff and jargon. Today, we’ll skip that and just tell you about some new tools you might find helpful.
New and improved free project trackers
One of our guiding principles as a company is to give away as much value for free as possible. That’s one reason why we write this newsletter and share insights each week. It’s also why we built our free project trackers.
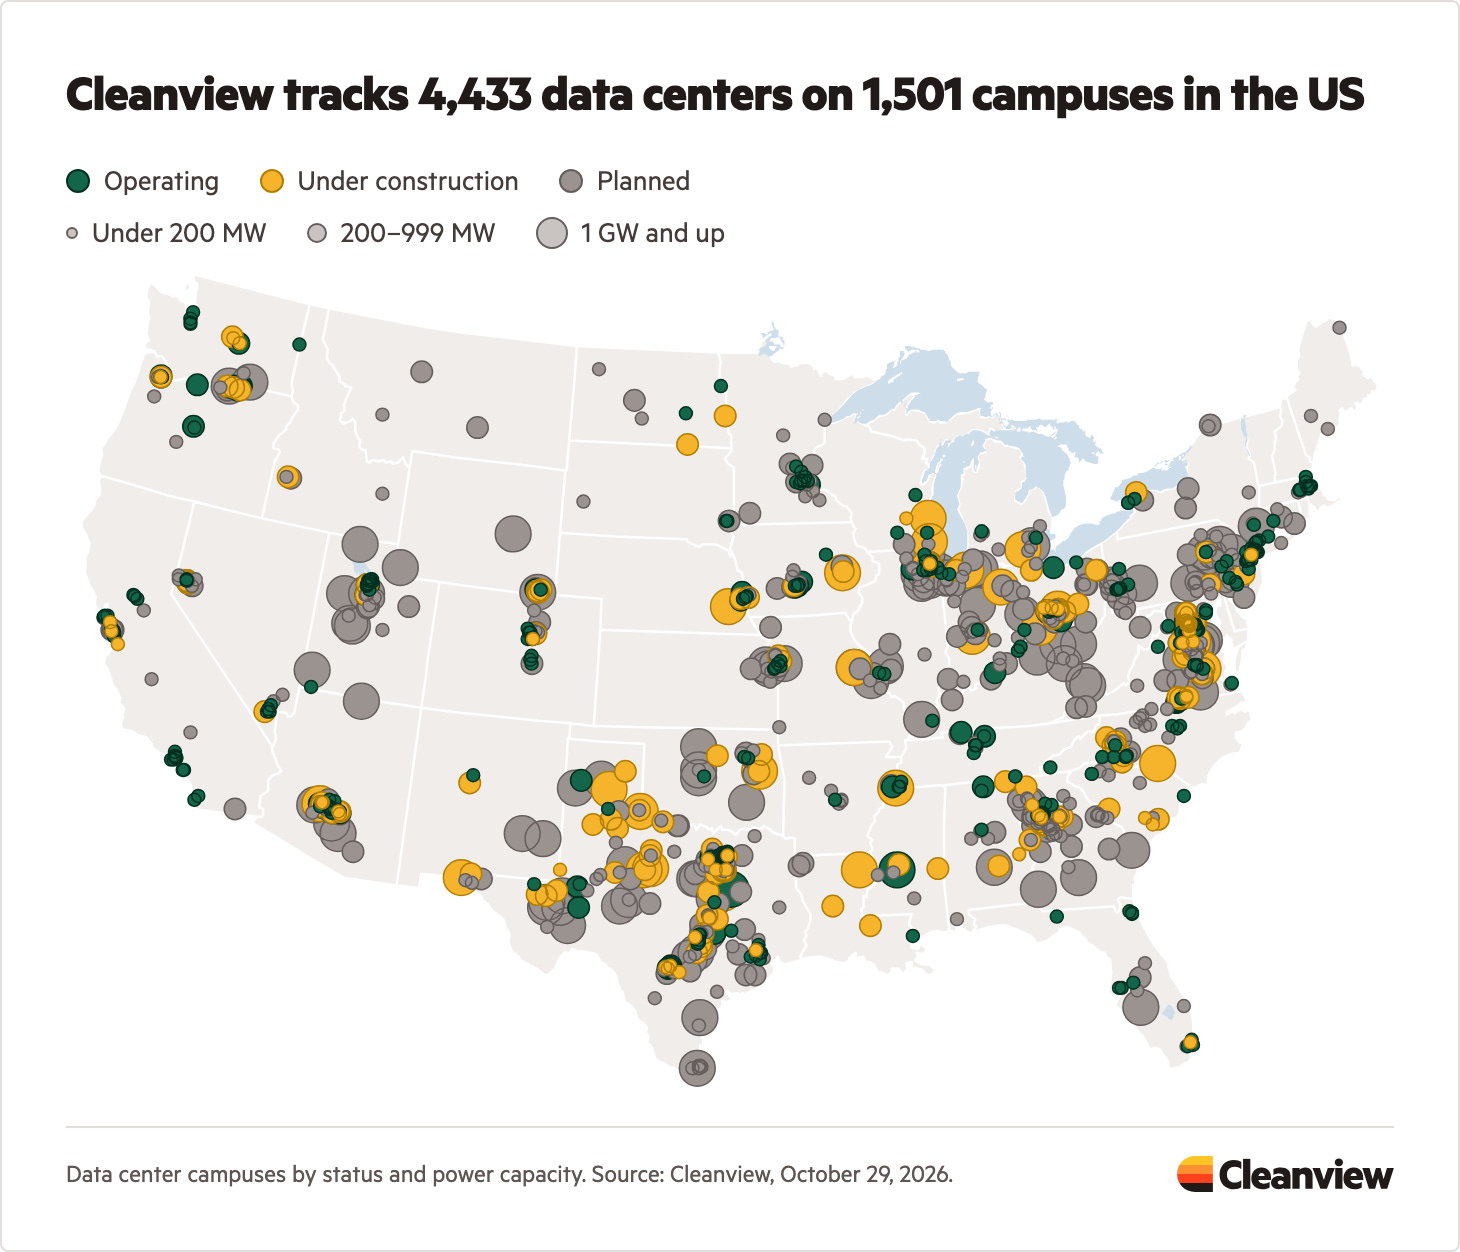
For each state in the US—and the country as a whole—we publish maps of every data center, renewable energy and storage project, and fossil fuel power plant. Each page also includes trends and lists of the largest projects.
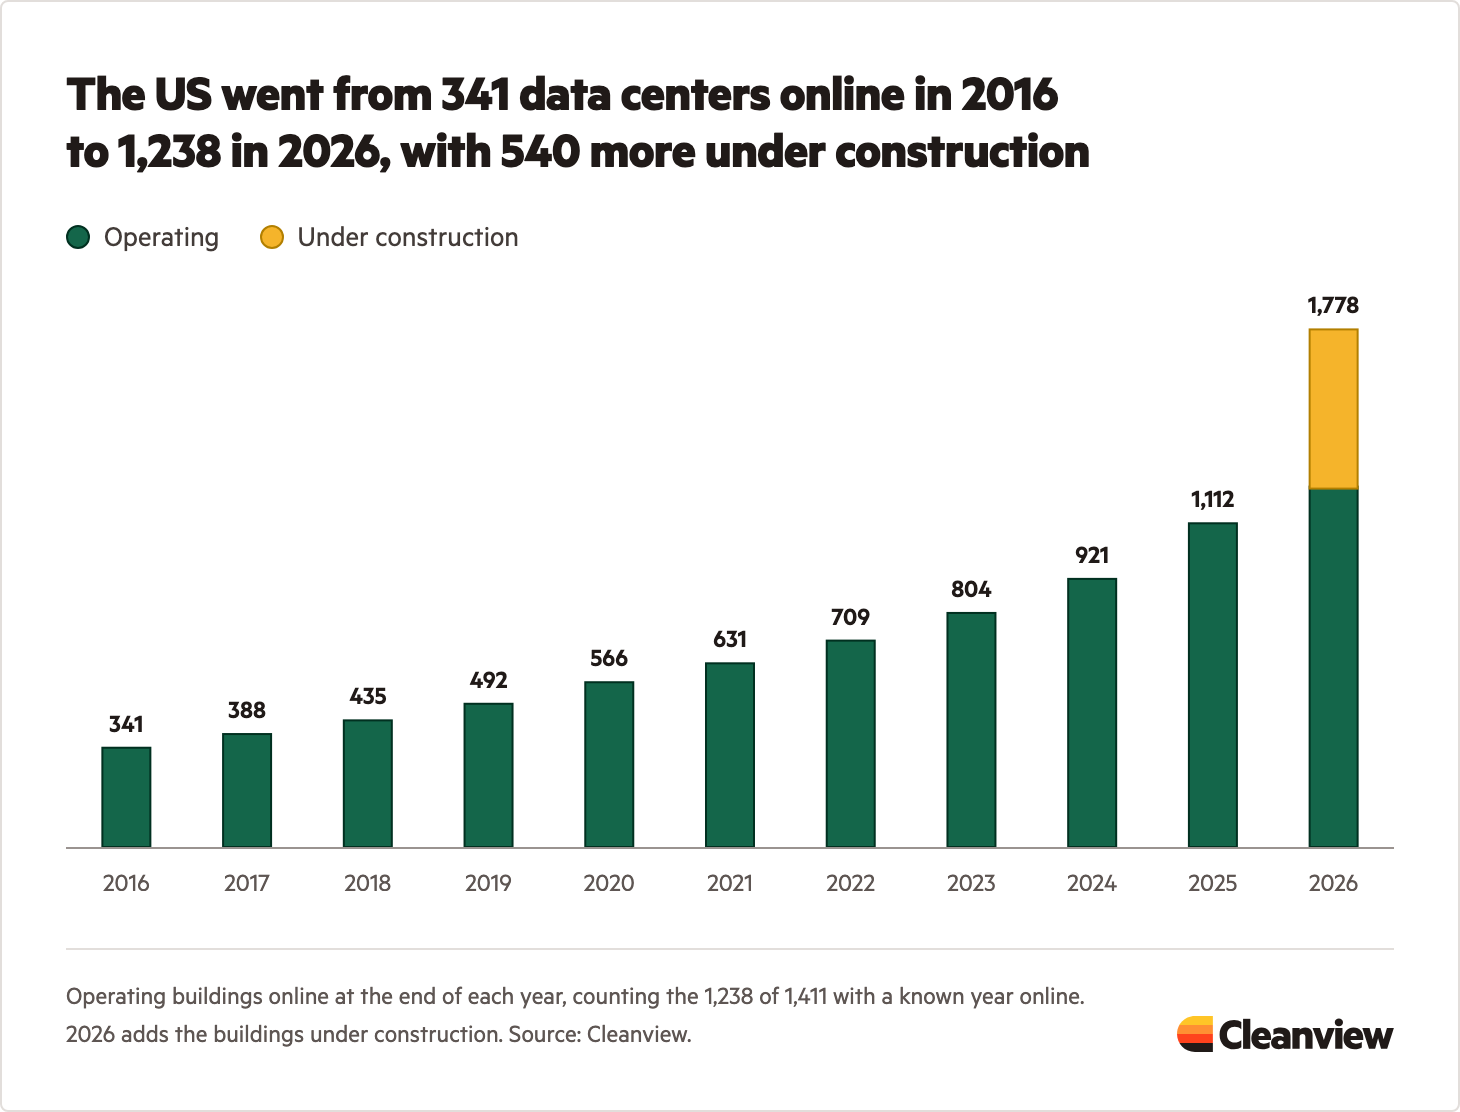
On our free data center tracker page, you can see how many data centers have been built every year over the last decade. The upshot: By the end of 2026, the US will have 5 times more data centers than it did in 2016.
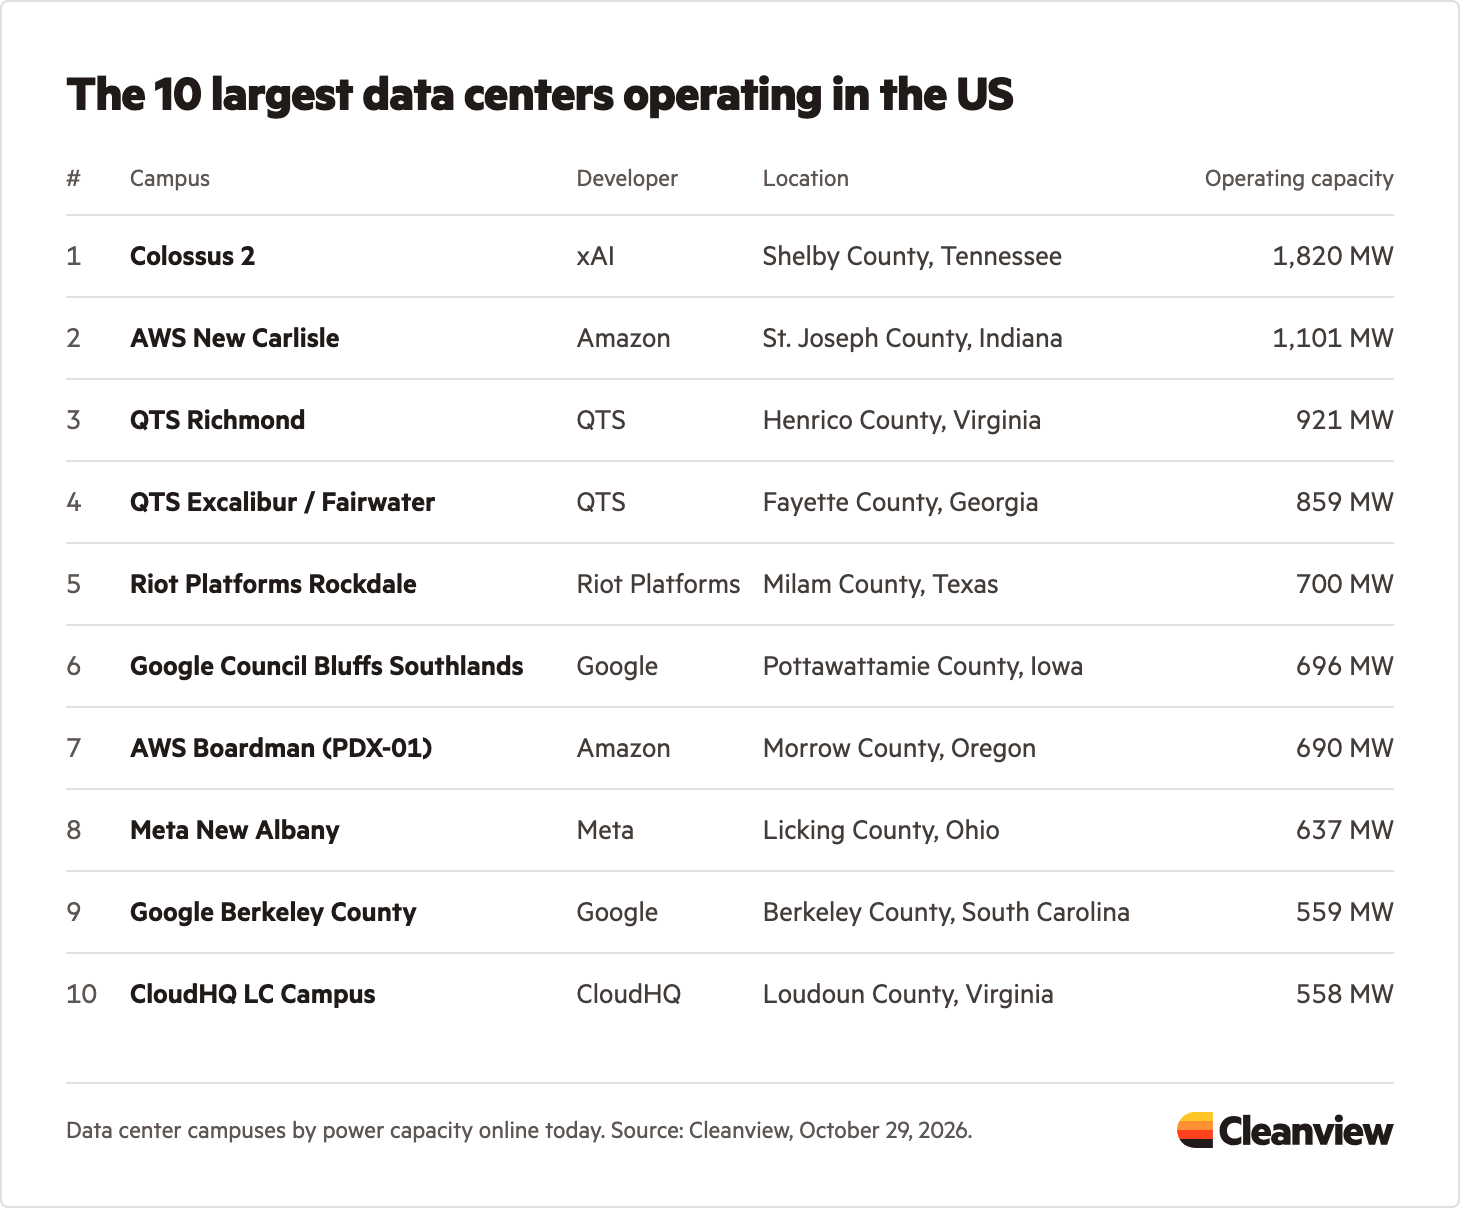
That same page also shows the largest data center campuses operating in the US. In our report on Amazon’s data center strategy, we wrote that the company had the largest data center operating at the beginning of this year. The company’s New Carlisle data center—built for Anthropic—surpassed 1 GW of power in March 2026.
Since then, xAI’s Colossus 2 has surged ahead. The campus now has 1.8 GW of active power. (Colossus 1 located just across the state border has another 300 MW operating).
We have similar maps, trends, and project lists for all the technologies we track, including:
Platform improvements
We’ve also made significant improvements to the Cleanview platform.
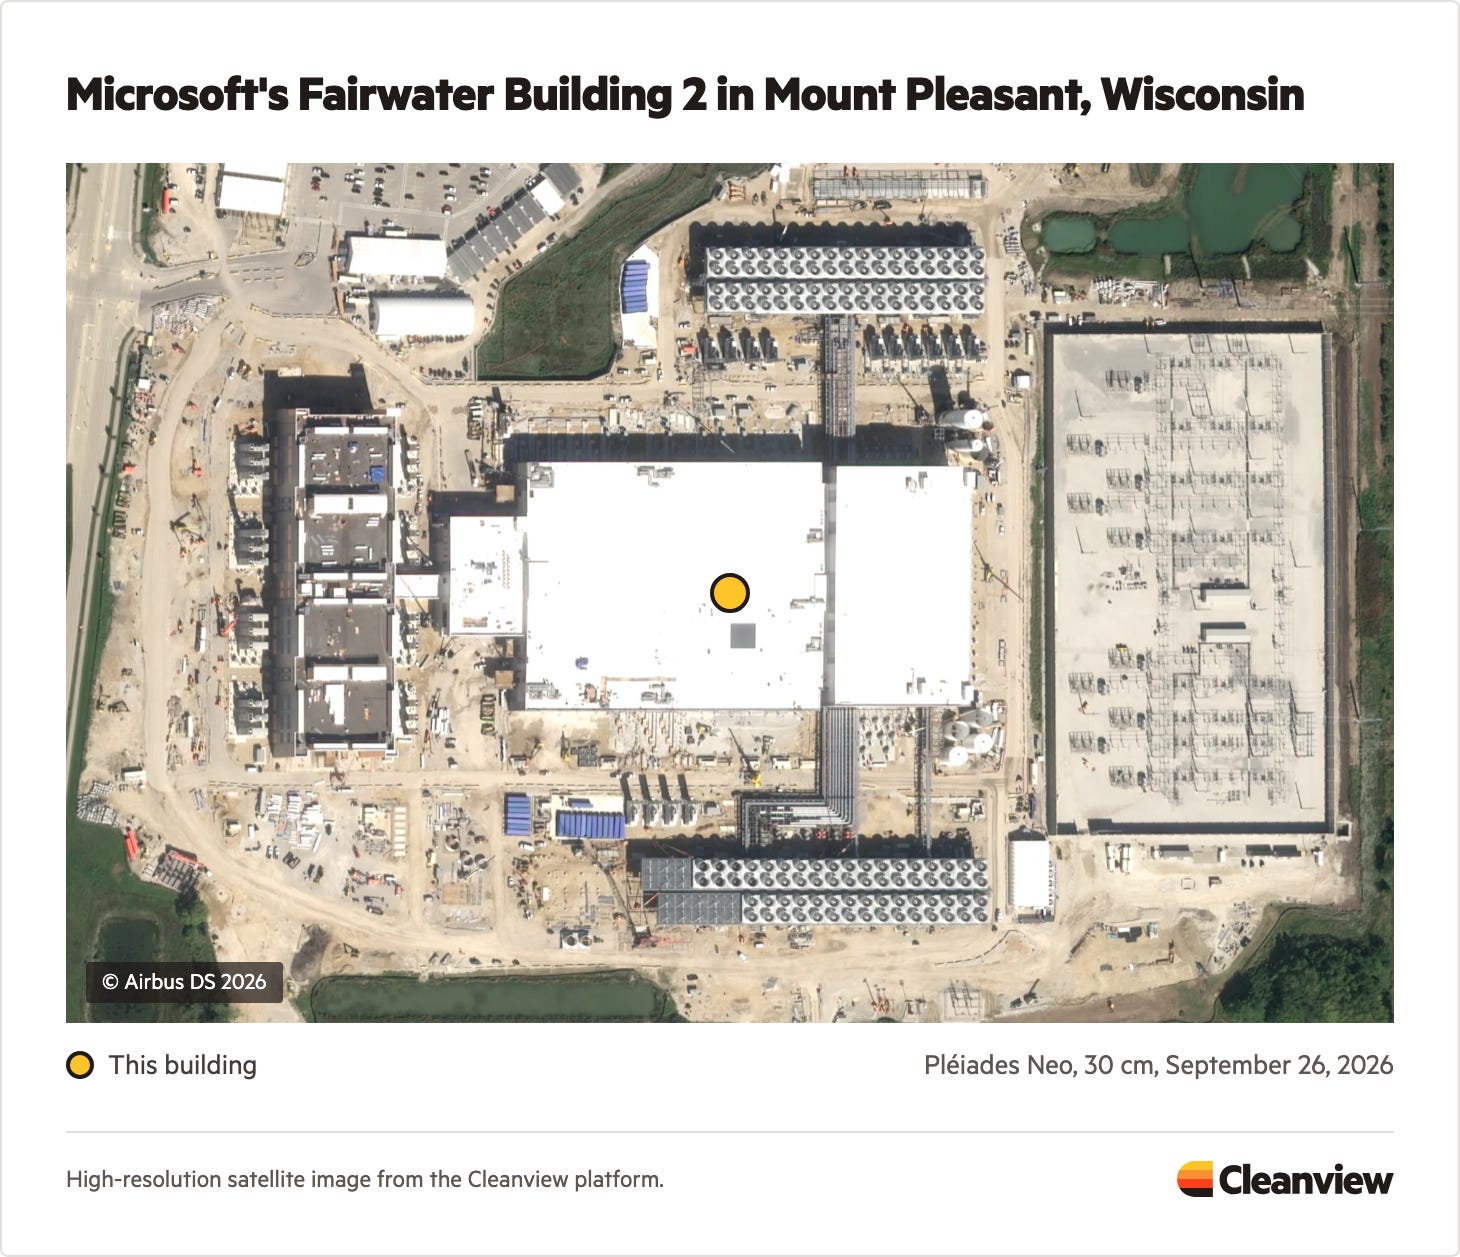
To track projects, we use satellite images from a number of different sources—including some that capture images of every location on Earth every five days. Now we show many of those satellite images in the platform for our customers to see what we see. As an example, here’s what Microsoft’s Fairwater Building 2 looked like four weeks ago:
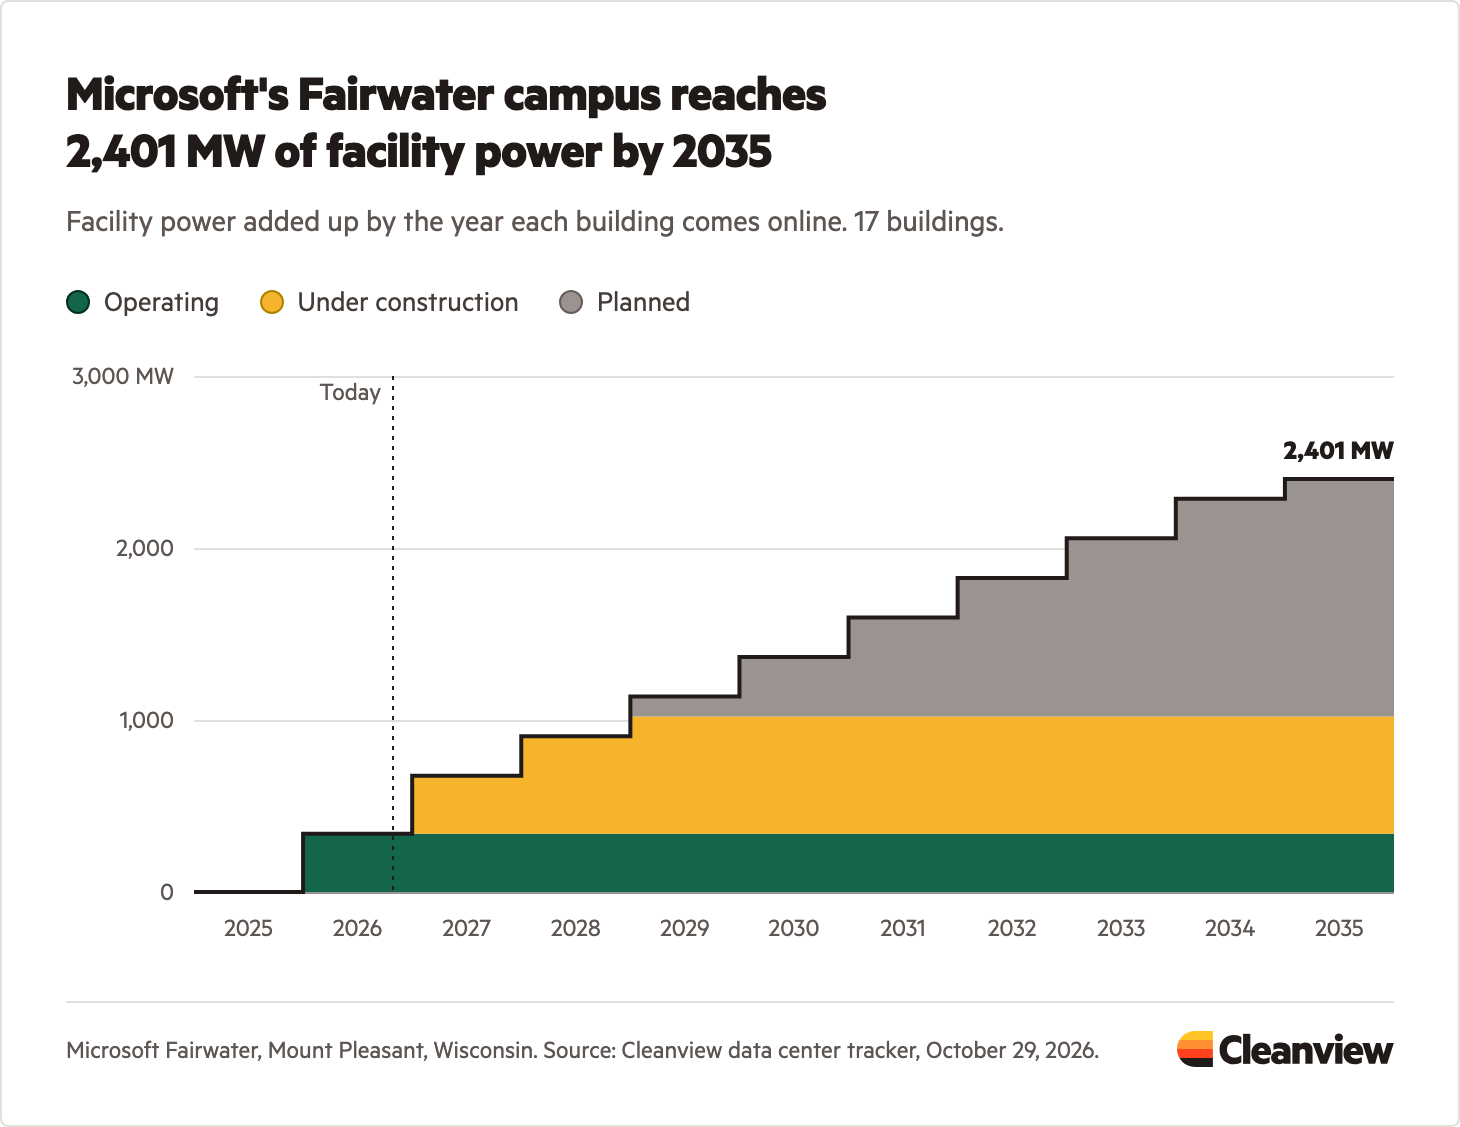
The hyperscale data center campuses we track have many buildings, each coming online at different times. Knowing when this capacity will hit the grid is important. There’s a big difference between 1 GW coming online in two years compared to ten.
That’s why we built our power ramp feature. In the platform, you can now see capacity projections by year and the current status of each building on a given campus. Here’s what that same Microsoft Fairwater campus looks like:
Check out these tools for yourself
If you’re a Cleanview customer, you can see these new improvements by logging in to your account. Otherwise, you can explore our free data center tracker here and our power project trackers here.
To learn more about Cleanview’s data platform and API, send us a note.
Thanks for reading Cleanview Newsletter! Subscribe for free to receive new posts and support my work.