7 charts that show the remarkable growth of solar energy
These graphs show how quickly solar power has grown recently
This story is part of a larger series exploring changes in America’s power grid. Check out our other stories on enhanced geothermal, battery storage, and rooftop solar. And subscribe to receive more stories like this in your inbox.
On December 15, 1982, developers from the energy company ARCO and executives at the utility Southern California Edison unveiled the world’s first commercial solar farm on the high desert of Hesperia, California, a hundred miles northeast of Los Angeles.
By that point, the biggest users of solar panels were NASA satellites and offshore oil rigs. The solar modules used at the Hesperia solar farm cost about 150 times more than they do today. Virtually no rooftops had solar panels on them.
A lot has changed since that day in 1982.
Last year, 1 megawatt (MW) of solar capacity—the same amount as the solar farm in Hesperia provided—was added to the grid every three minutes in America. Solar is now the most popular form of new electricity generating capacity. It is so cheap and bountiful in some places that during the sunniest hours of the day it’s not just free to use it; energy producers will actually pay you to take solar electricity off their hands.
These changes took place much like we humans tend to fall asleep— slowly, and then all at once.
Between 2000 and 2010, solar production grew by a factor of 20. The following decade, growth accelerated even more; between 2010 and 2020, production grew by a factor of 35. Over the last ten years solar has grown by an average of 30% per year.
Solar is cheap and getting cheaper
The growth of solar has been driven largely by massive cost reductions.
In 1975, the average solar photovoltaic module cost a little more than $115 per watt. To put that in perspective, at that price, it would cost more than $1 million to install solar panels on your roof.
Since then, solar costs have fallen by a factor of 400. In 2021, even after a tumultuous year of supply chain disruption, the average solar photovoltaic module cost $0.27 per watt.
It now costs about $20,000 on average to install solar panels on the roof of an average sized American home. In countries like Australia, where “soft costs” like permits and marketing, aren’t as high, it costs between $5,000 and $10,000 on average.
These price declines have helped solar become the cheapest electricity in history. According to a recent report by Energy Innovation, it’s now cheaper to build a new solar farm than operate an existing coal power plant in almost every part of America.
Experts continue to underestimate solar’s growth potential
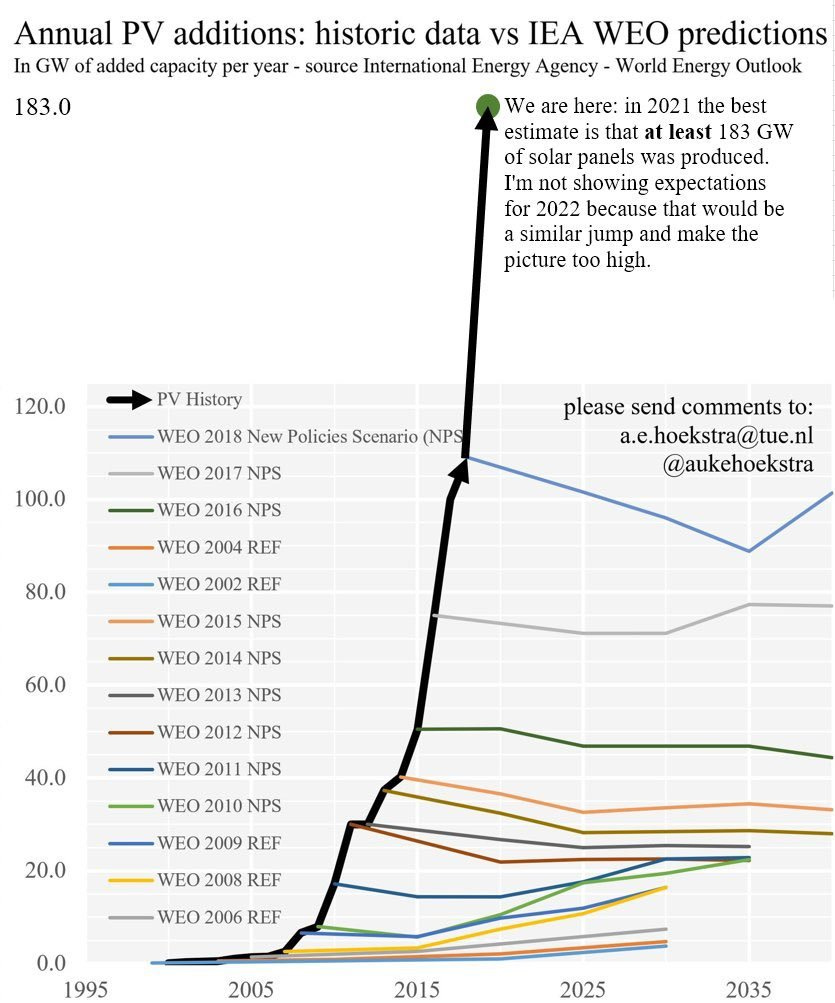
In 2010, some of the world’s smartest energy analysts, working at the International Energy Agency (IEA), predicted that by 2035 the world would generate 630 TWh of electricity from solar annually.
This prediction proved to be wildly inaccurate.
By 2019, the world generated that much solar annually, 16 years ahead of schedule. Last year, the world generated twice that amount.
Given the consistent growth of solar over the last decade, you’d think that IEA would update some of their assumptions and predictions. To some extent they have. But the world’s top energy agency continues to underestimate the growth of solar.
In 2015, their most optimistic scenario had the world generating 2,232 TWh of solar energy by 2040. But based on recent growth rates, it seems very likely that the world will generate that much in 2025 or 2026. Once again, it looks like they will be off by about 16 years.
Solar is growing faster than any other energy source in recent history
To be fair to the IEA, solar’s growth is unprecedented. As this wonderful chart from Nat Bullard shows, solar is growing faster than nuclear, wind, and LNG did in their early days.

This chart is adapted from a similar version that Shell published recently. In their report the oil giant writes, “Every significant change in the world’s energy system so far – from the adoption of coal to the use of nuclear power – has taken many decades to become established.”
Later, they go on, “The early indications… suggest solar and wind power are indeed being adopted much faster than previous technologies.”
Solar makes up the majority of new power capacity
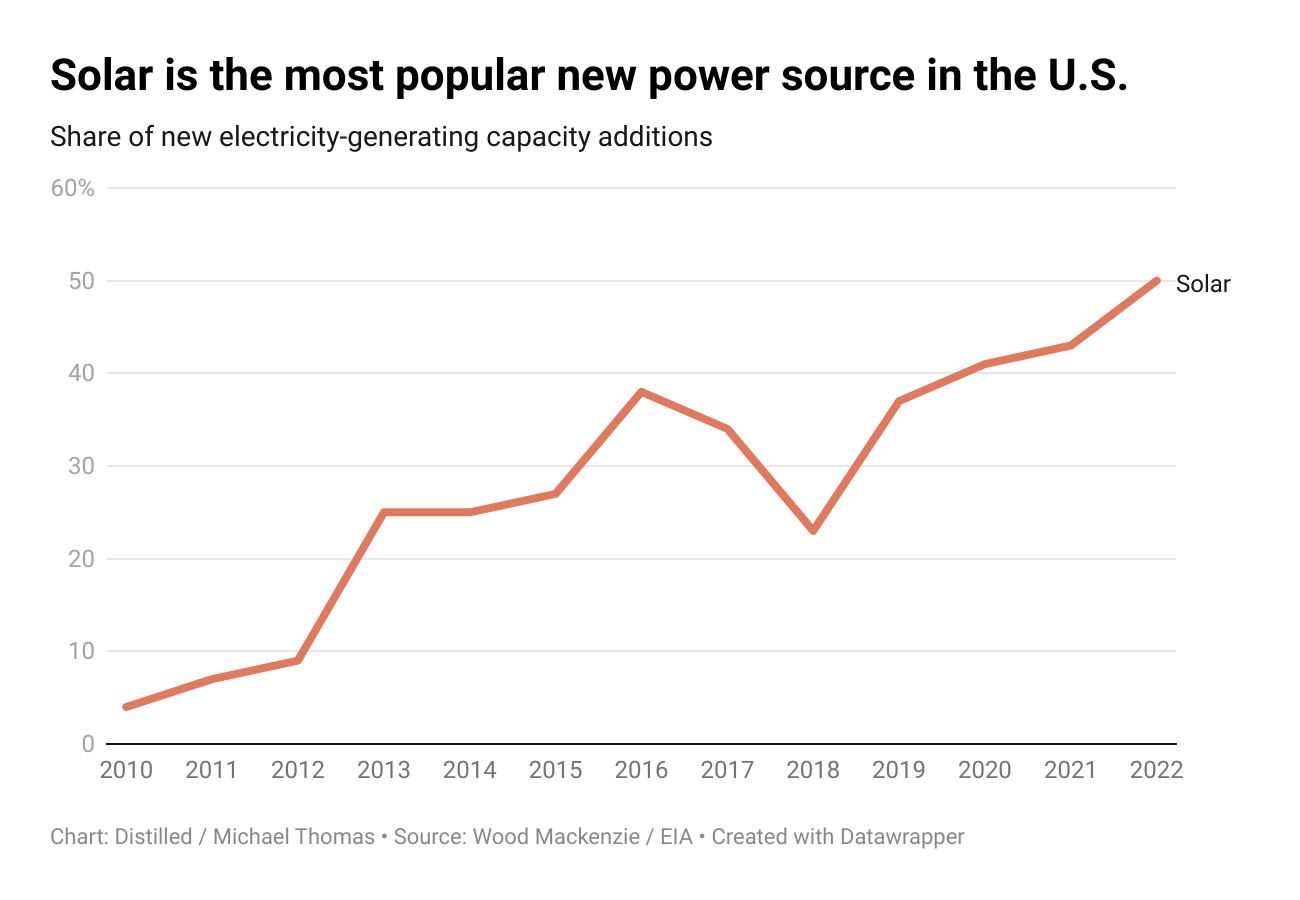
A decade ago most utilities in America were still reluctant to build solar farms. In 2010, fossil fuel power plants were responsible for about two-thirds of newly built electricity-generating capacity. That year solar only made up 4% of new capacity additions.
Things are very different now.
In 2022, solar was responsible for half of all new power capacity added to the grid. Wind made up another quarter of new capacity, while fossil fuel power was only responsible for 17% of new additions.
A few states generate most solar power in the U.S.
Solar’s growth in America hasn’t been evenly distributed. Three states—California, Texas, and North Carolina—generate half of all utility-scale solar power in America. 10 states generate 80%.
When I pointed this out on Twitter last week, I got a few snarky replies about how these states have large populations and a lot of sunshine. Of course, they generate the most power!
But sunshine and population alone don’t explain where solar is growing fastest. If it did, we could expect a lot more solar power in populous, sunny states like Tennessee and Louisiana. In fact, many sunny southern states generate very little power from solar.
The growth of solar is determined as much by policy design choices as population or geography.
Democrats’ big climate bill will supercharge solar
As the IEA’s energy analysts will tell you, predicting the growth of solar is difficult. Virtually everyone expects huge growth following Biden’s climate bill passed last year. Just how much growth will come from the bill is hard to say.
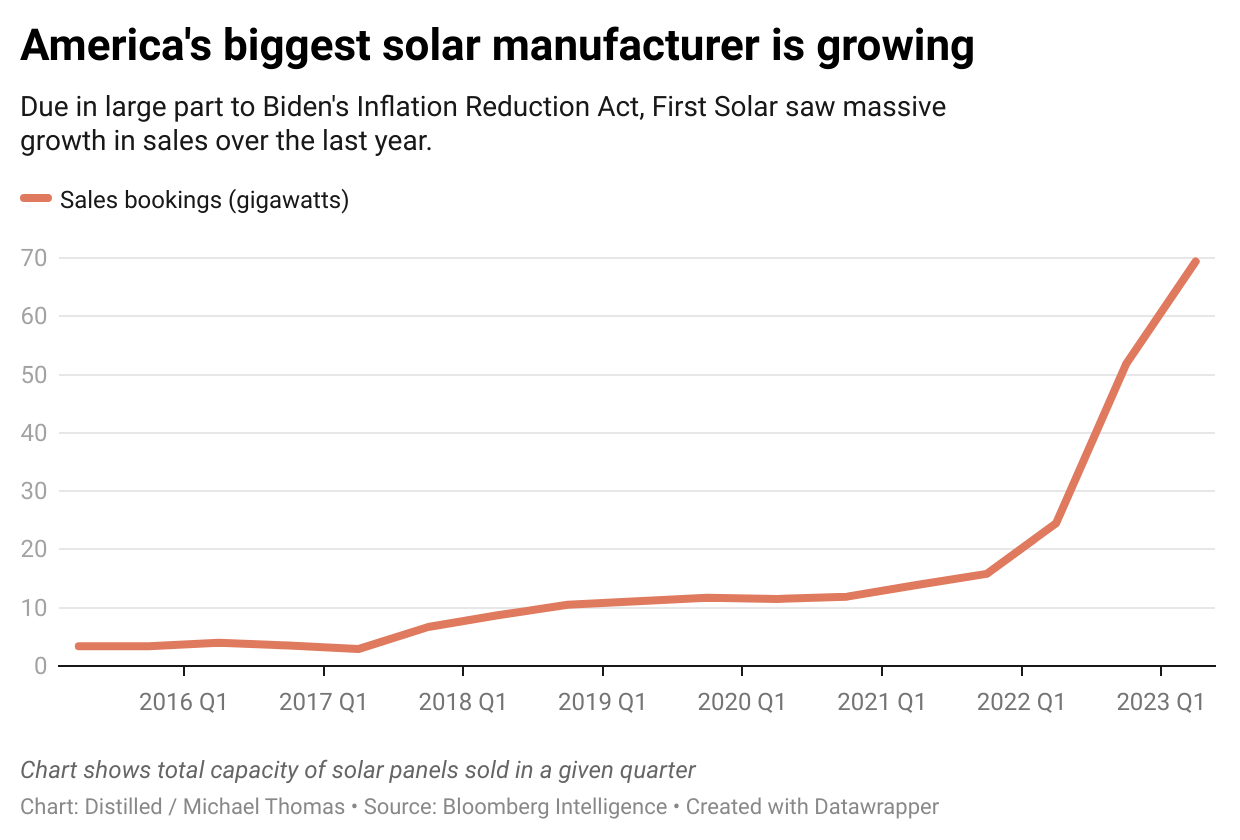
But one good way to predict growth in the short term is by looking at the signed contracts between solar installers and manufacturers, like First Solar, that supply their panels. That’s what Bloomberg’s Nat Bullard did recently. So what’d he find? American companies are going to install a lot of solar panels over the next couple years.
As Bullard writes:
First Solar’s order book, the total of its expected future sales, grew slowly if steadily over the second half of the last decade. By the start of 2020, it had reached 11.5 gigawatts — a significant if not massive number in the global context.
Since then, though, it has grown almost seven-fold, including a doubling from the second quarter of 2022 to the end of the first quarter of 2023. (Biden signed the IRA into law in August 2022.)
Bloomberg NEF, where Bullard is a contributor, has been one of the most accurate predictors of solar growth over the last decade. In total, their team of analysts expect total solar capacity to grow by a factor of three between now and 2030.
We still have a lot of work to do
Even with all the growth described above, all the solar panels in America generate just under 5% of electricity in both the U.S. and the world. But even that statistic risks overstating solar’s current position in the energy mix.
If you count up all the energy produced in the world—including fuels like oil and natural gas that are burned directly in machines—solar’s role looks even smaller: Sun rays are responsible for less than 2% of primary energy production globally.
In order to reach net-zero emissions by 2050, global solar production needs to grow by a factor of 7 by the end of the decade.

There are a lot of obstacles between where we are today and 7 times more solar generation. Everything from disinformation to local opposition to limited transmission capacity could slow solar’s growth. As financial planners like to say, “Past performance is no guarantee of future results.”
But if there’s one thing solar has done consistently over the last decade, it’s prove pessimists wrong.
Read the rest of this series
Subscribe to our newsletter
We publish stories like this every week. Sign up for our newsletter to get them delivered to your inbox.








… fascinating and hopeful, but why won’t my dumb HOA embrace solar instead of never approving it… it’s so backwards!